Visualize_EDA
Description
This API has the functionality to display the data in an easy-to-understand image format, which helps in setting the data preprocessing methods.
There are Four Options, as follows:
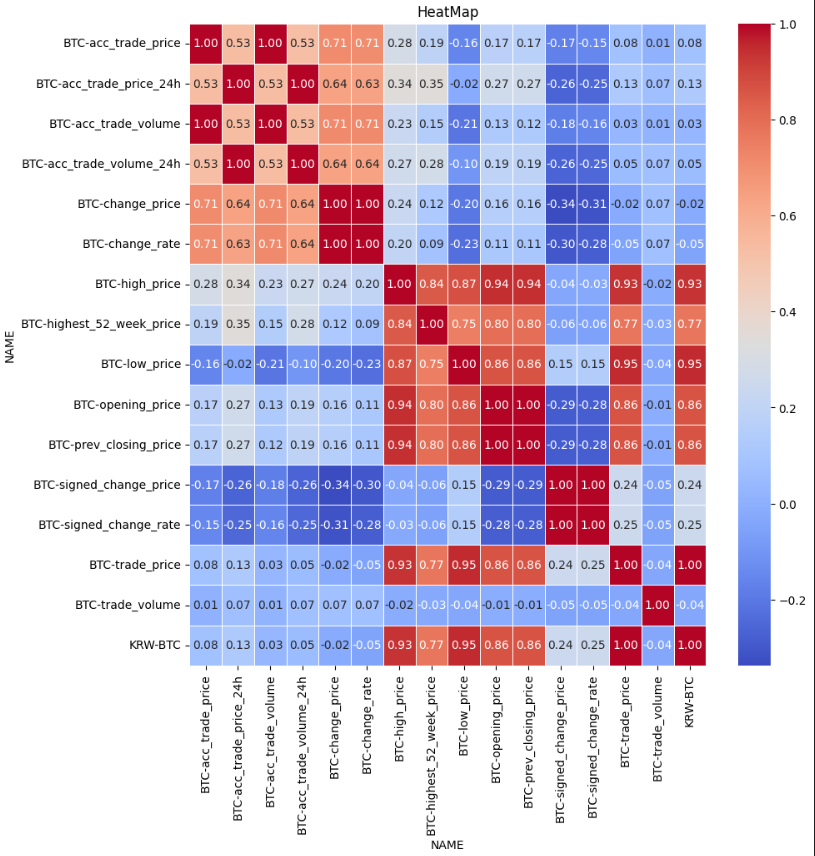
- HeatMap
- Plot
- Decomposition
- All
Upon execution, the result image is displayed and simultaneously saved in the EDA folder.
API module path
from api.v2.eda.Visualize_EDA import Visualize_EDA
Parameters
Df
- Specifies the DataFrame composed of time series data.
Period
- Specifies the Period.
- The number of time steps it takes for the time series data to complete one full cycle, representing the period of the repeating seasonal pattern.
- Example
- period = 24
X_size
- Specifies the Plot width.
- Set the width value of the result image to be output and saved.
- Example
- x_size = 10
Y_size
- Specifies the Plot height.
- Set the height value of the result image to be output and saved.
- Example
- y_size = 10
Option
- Specifies the desired option.
- 1 : HeatMap
- 2 : Plot
- 3 : Decomposition
- 4 : All
- Example
- option = 4
Example Sample Code (Python)
Results
- Due to the large output, only the HeatMap results are provided.
Check the entire module code.
datahub/api/v2/eda/Visualize_EDA.py at main · machbase/datahub
All Industrial IoT DataHub with data visualization and AI source - machbase/datahub
 machbase