India Air Quality Data

This post describes how to use India Air Quality Data to forecast nitrogen dioxide levels through AI learning.
Table of Contents
- Data Introduction
- Data Visualization with Machbase Neo
- Table Creation and Data Upload in Machbase Neo
- Experimental Methodology
- Experiment Code
- Experimental Results
1. Data Introduction
- DataHub Serial Number: 2024-13.
- Data Name: India Air Quality Data.
- Data Collection Methods: Data collection on air quality in 453 cities in India from 2010 to 2023 at the Central Control Room for Air Quality Management.
| STATE | CITIES |
|---|---|
| Andhra Pradesh | Amaravati, Anantapur, Chittoor, Kadapa, Rajamahendravaram, Tirupati, Vijayawada, Visakhapatnam |
| Arunachal Pradesh | Naharlagun |
| Assam | Byrnihat, Guwahati, Nagaon, Nalbari, Silchar, Sivasagar |
| Bihar | Araria, Arrah, Aurangabad, Begusarai, Bettiah, Bhagalpur, Bihar Sharif, Buxar, Chhapra, Darbhanga, Gaya, Hajipur, Katihar, Kishanganj, Manguraha, Motihari, Munger, Muzaffarpur, Patna, Purnia, Rajgir, Saharsa, Samastipur, Sasaram, Siwan |
| Chandigarh | Chandigarh |
| Chhattisgarh | Bhilai, Bilaspur, Chhal, Korba, Kunjemura, Milupara, Raipur, Tumidih |
| Delhi | Delhi |
| Gujarat | Ahmedabad, Ankleshwar, Gandhinagar, Nandesari, Surat, Vapi, Vatva |
| Haryana | Ambala, Bahadurgarh, Ballabgarh, Bhiwani, Charkhi Dadri, Dharuhera, Faridabad, Fatehabad, Gurugram, Hisar, Jind, Kaithal, Karnal, Kurukshetra, Mandikhera, Manesar, Narnaul, Palwal, Panchkula, Panipat, Rohtak, Sirsa, Sonipat, Yamuna Nagar |
| Himachal Pradesh | Baddi |
| Jammu and Kashmir | Srinagar |
| Jharkhand | Dhanbad, Jorapokhar |
| Karnataka | Bagalkot, Belgaum, Bengaluru, Bidar, Chamarajanagar, Chikkaballapur, Chikkamagaluru, Davanagere, Dharwad, Gadag, Hassan, Haveri, Hubballi, Kalaburagi, Kolar, Koppal, Madikeri, Mangalore, Mysuru, Raichur, Ramanagara, Shivamogga, Tumakuru, Udupi, Vijayapura, Yadgir |
| Kerala | Eloor, Ernakulam, Kannur, Kochi, Kollam, Kozhikode, Thiruvananthapuram, Thrissur |
| Madhya Pradesh | Bhopal, Damoh, Dewas, Gwalior, Indore, Jabalpur, Katni, Maihar, Mandideep, Pithampur, Ratlam, Sagar, Satna, Singrauli, Ujjain |
| Maharashtra | Aurangabad, Chandrapur, Kalyan, Mumbai, Nagpur, Nashik, Navi Mumbai, Pune, Solapur, Thane |
| Manipur | Imphal |
| Meghalaya | Shillong |
| Mizoram | Aizawl |
| Nagaland | Kohima |
| Odisha | Baripada, Bileipada, Brajrajnagar, Keonjhar, Nayagarh, Rairangpur, Rourkela, Suakati, Talcher, Tensa |
| Puducherry | Puducherry |
| Punjab | Amritsar, Bathinda, Jalandhar, Khanna, Ludhiana, Mandi Gobindgarh, Patiala, Rupnagar |
| Rajasthan | Ajmer, Alwar, Banswara, Barmer, Bharatpur, Bhiwadi, Bikaner, Chittorgarh, Churu, Dausa, Dholpur, Hanumangarh, Jaipur, Jaisalmer, Jhalawar, Jhunjhunu, Jodhpur, Karauli, Kota, Pali, Pratapgarh, Rajsamand, Sawai Madhopur, Sikar, Sirohi, Sri Ganganagar, Udaipur |
| Sikkim | Gangtok |
| Tamil Nadu | Ariyalur, Chengalpattu, Chennai, Coimbatore, Cuddalore, Dindigul, Gummidipoondi, Hosur, Kanchipuram, Ooty, Palkalaiperur, Ramanathapuram, Salem, Thoothukudi, Tirupur, Vellore |
| Telangana | Hyderabad |
| Tripura | Agartala |
| Uttar Pradesh | Agra, Baghpat, Bareilly, Bulandshahr, Firozabad, Ghaziabad, Gorakhpur, Greater Noida, Hapur, Jhansi, Kanpur, Khurja, Lucknow, Meerut, Moradabad, Muzaffarnagar, Noida, Prayagraj, Varanasi, Vrindavan |
| Uttarakhand | Dehradun, Kashipur, Rishikesh |
| West Bengal | Asansol, Durgapur, Haldia, Howrah, Kolkata, Siliguri |
- Data Source: Link
- Raw data size and format: 1.57GB, CSV.
- Number of tags: 35 (The column structure varies for each city).
| TAG | DESCRIPTION |
|---|---|
| PM10 | Particulate Matter 10 (ug/m³) |
| PM2.5 | Particulate Matter 2.5 (ug/m³) |
| CO | Carbon Monoxide (mg/Nm³, mg/m³, ng/m³, ug/m³) |
| CO2 | Carbon Dioxide (mg/m³) |
| NO | Nitric Oxide (mg/m³, ppb, ppm, ug/m³) |
| NO2 | Nitrogen Dioxide (ug/m³) |
| NOx | Nitrogen Oxides (ppb, ppm, ug/m³) |
| NH3 | Ammonia (ppb, ug/m³) |
| SO2 | Sulfur Dioxide (ug/m³) |
| Temp | Temperature (degrees Celsius or ug/m³) |
| AT | Air Temperature (degrees Celsius or ug/m³) |
| BP | Barometric Pressure (W/mt², mg/m³, mmHg) |
| Benzene | Concentration of Benzene in the air (mg/m³ or ug/m³) |
| CH4 | Methane (ug/m³) |
| Eth-Benzene | Concentration of Ethylbenzene in the air (ug/m³) |
| Gust | Wind Gust (kl/h, km/hr, m/s) |
| HCHO | Formaldehyde (ug/m³) |
| Hg | Mercury (ug/m³) |
| MH | Mixing Height (meters (m)) |
| MP-Xylene | Concentration of Meta-Para Xylene in the air (ug/m³) |
| NMHC | Non-Methane Hydrocarbons (ug/m³) |
| O Xylene | Concentration of Ortho-Xylene in the air (ug/m³) |
| Ozone | Ozone Concentration (ppb, ug/m³) |
| Power | Power Consumption (Watts (W)) |
| RF | Rainfall (m/s, mm) |
| RH | Relative Humidity (%, W/mt², degree) |
| SPM | Suspended Particulate Matter (ug/m³) |
| SR | Solar Radiation (W/mt², ug/m³) |
| THC | Total Hydrocarbons (ug/m³) |
| Toluene | Concentration of Toluene in the air (ug/m³) |
| VWS | Wind Speed (degree, m/s) |
| Variance | Variance (n) |
| WD | Wind Direction (deg, degree C, degree) |
| WS | Wind Speed (m/s, ug/m³) |
| Xylene | Concentration of Xylene in the air (ug/m³) |
- Data Time Range: 2016-07-01 10:00:00 to 2023-03-31 23:00:00.
- Number of data records collected: 108,383,769.
- CSV data URL: https://data.yotahub.com/2024-13/datahub-2024-13-India-Air-Quality.csv.gz
- Data Migration: India Air Quality Data Migration
2. Data Visualization with Machbase Neo
- Data visualization is possible through the Tag Analyzer in Machbase Neo.
- Select desired tag names and visualize them in various types of graphs.
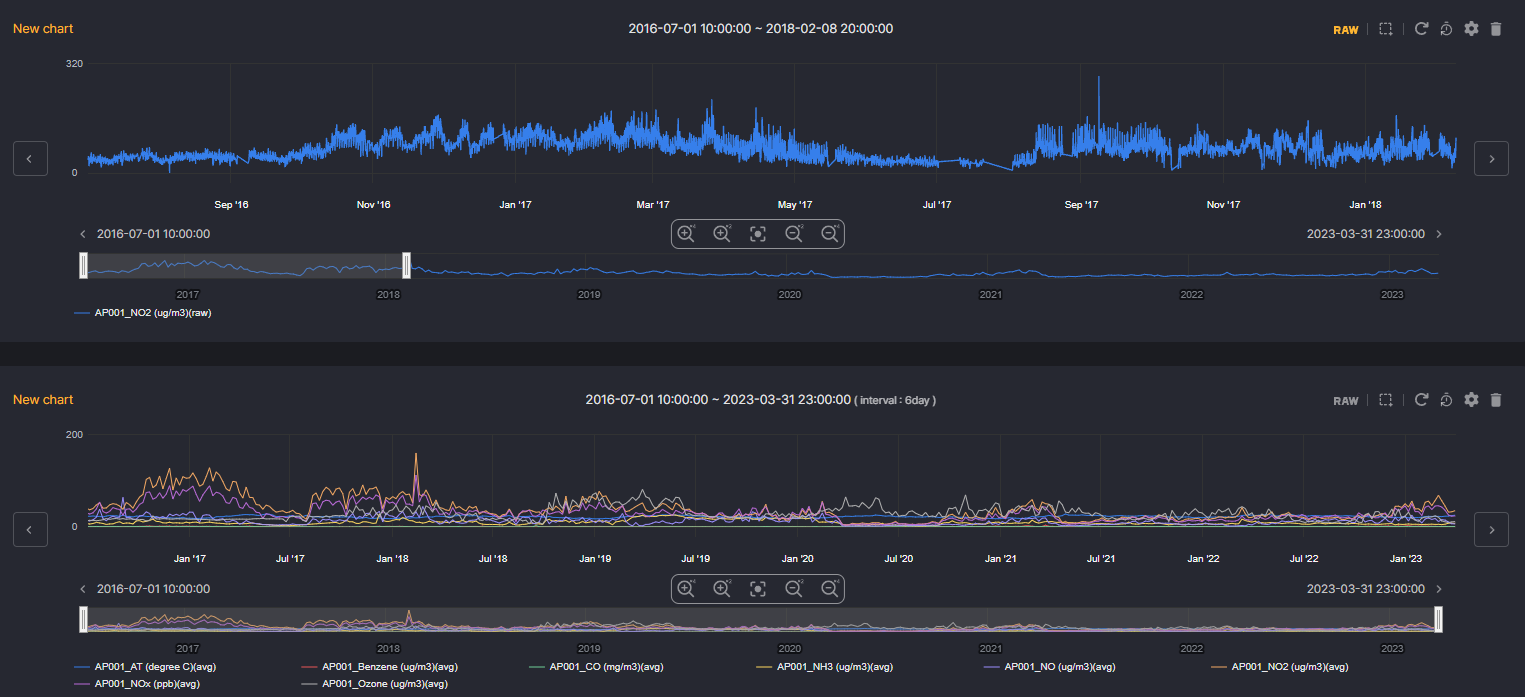
- Below, access the 2024-13 DataHub in real-time, select the desired tag names from the data of 35 tags, visualize them, and preview the data patterns.
DataHub Viewer
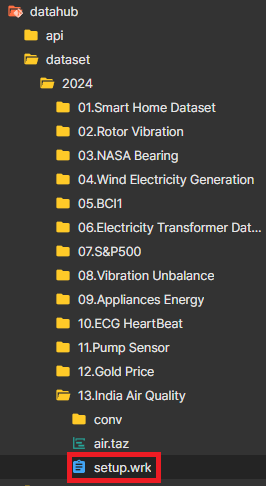
3. Table Creation and Data Upload in Machbase Neo
- In the DataHub directory, use setup.wrk located in the India Air Quality Dataset folder to create tables and load data, as illustrated in the image below.
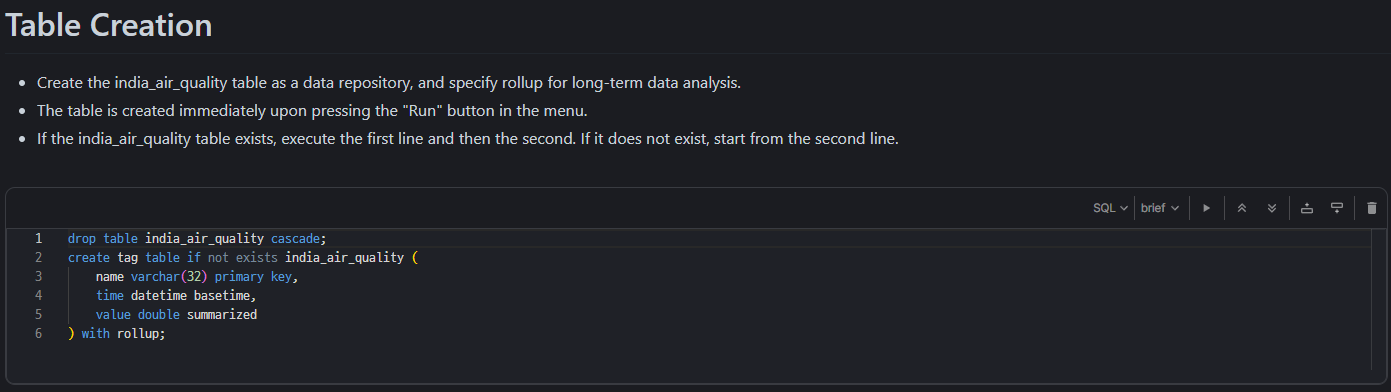
1) Table Creation
- The table is created immediately upon pressing the "Run" button in the menu.
- If the india_air_quality table exists, execute the first line and then the second. If it does not exist, start from the second line.
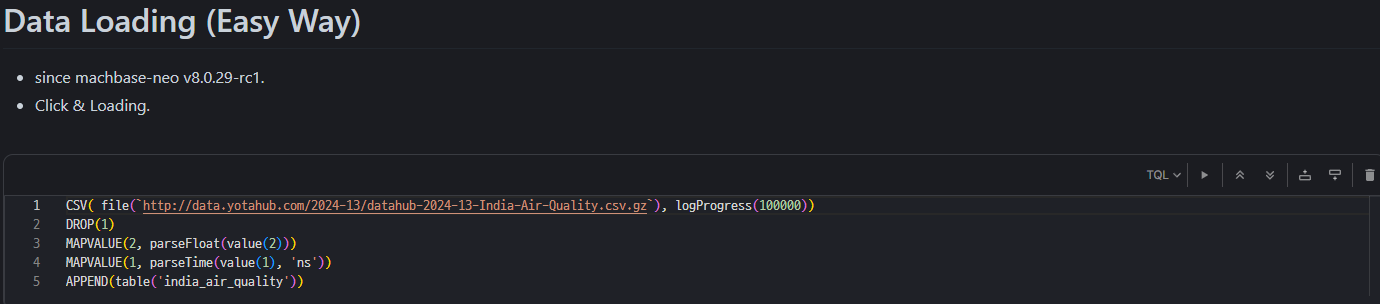
2) Data Upload
- Loading tables in two different ways.
Method 1) Table loading method using TQL in Machbase Neo (since machbase-neo v8.0.29-rc1
-
Pros
- Machbase Neo loads as soon as you hit the launch button.
-
Cons
- Slower table loading speed compared to other method.
Method 2) Loading tables using commands
-
Pros
- Fast table loading speed.
-
Cons
- The table loading process is cumbersome.
- Run cmd window - Change machbase-neo path - Enter command in cmd window.
- If run the below script from the command shell, the data will be entered at high speed into the india_air_quality table.
curl http://data.yotahub.com/2024-13/datahub-2024-13-India-Air-Quality.csv.gz | machbase-neo shell import --input - --compress gzip --header --method append --timeformat ns india_air_quality
- If specify a separate username and password, use the --user and --password options (if not sys/manager) and add the options as shown below.
curl http://data.yotahub.com/2024-13/datahub-2024-13-India-Air-Quality.csv.gz | machbase-neo shell import --input - --compress gzip --header --method append --timeformat ns india_air_quality --user USERNAME --password PASSWORD
4. Experimental Methodology
- Model Objective: Nitrogen Dioxide Levels Forecasting.
- Tags Used: AP001 tags.
- Model Configuration: Temporal Convolutional Network(TCN).
- Learning Method: supervised Learning.
- Train: Model Training.
- Test: Model Performance Evaluation Based on Nitrogen Dioxide Levels Forecasting.
- Model Optimizer: Adam.
- Model Loss Function: Mean Squared Error.
- Model Performance Metric: Mean Squared Error & R2 Score.
- Data Loading Method
- Loading the Entire Dataset.
- Loading the Batch Dataset.
- Data Preprocessing
- MinMax Scaling.
5. Experiment Code
- Below is the code for each of the two ways to get data from the database.
- If all the data can be loaded and trained at once without causing memory errors, then method 1 is the fastest and simplest.
- If the data is too large, causing memory errors, then the batch loading method proposed in method 2 is the most efficient.
Method 1) Loading the Entire Dataset
- The code below is implemented in a way that loads all the data needed for training from the database all at once.
- It is exactly the same as loading all CSV files (The only difference is that the data is loaded from Machbase Neo).
- Pros
- Can use the same code that was previously utilizing CSVs (Only the loading process is different).
- Cons
- Unable to train if trainable data size exceeds memory size.
- The entire code can be run through 13.India_Air_Quality_General.ipynb.
Method 2) Loading the Batch Dataset
- Method for loading data from the Machbase Neo for a single batch size.
- The code below is for fetching a time range sequentially for a single batch size.
- Pros
- It is possible to train the model regardless of the data size, no matter how large it is.
- Cons
- It takes longer to train compared to method 1.
- The entire code can be run through 13.India_Air_Quality_New_Batch.ipynb.
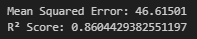
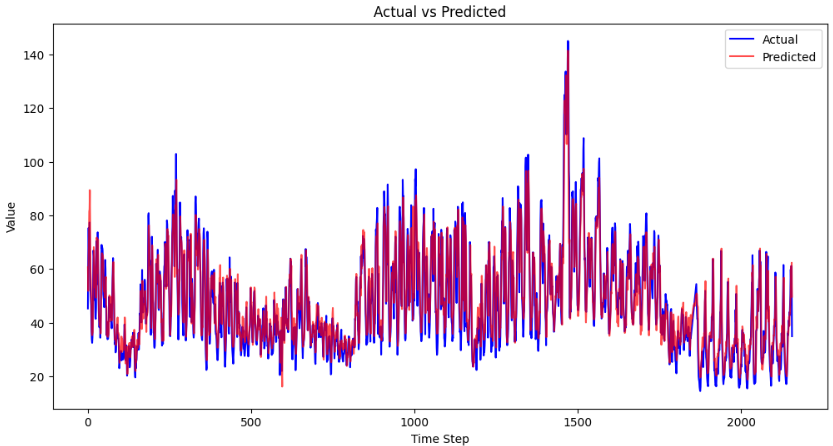
6. Experimental Results
Method 1) Loading the Entire Dataset Result
Method 2) Loading the Batch Dataset Result

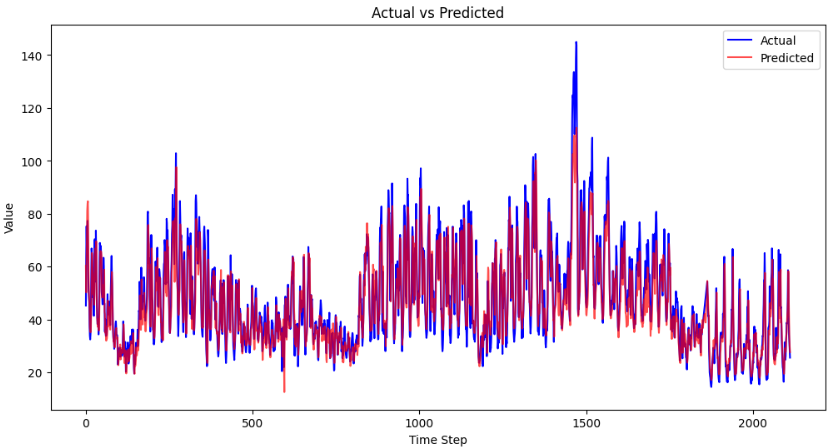
- The R2 score for loading the entire dataset resulted in 0.86, loading the batch dataset resulted in same 0.833.
※ Various datasets and tutorial codes can be found in the GitHub repository below.
datahub/dataset/2024 at main · machbase/datahub
All Industrial IoT DataHub with data visualization and AI source - machbase/datahub
 machbase