Bitcoin Data

This post describes how to use Bitcoin Data to forecast Bitcoin Price through AI learning.
Table of Contents
- Data Introduction
- Data Visualization with Machbase Neo
- Table Creation and Data Upload in Machbase Neo
- Experimental Methodology
- Experiment Code
- Experimental Results
1. Data Introduction
- DataHub Serial Number: 2024-17.
- Data Name: Bitcoin Data.
- Data Collection Methods: Collected Bitcoin data from the Bithumb API to Machbase Neo at 1-second intervals(Resample at 1-minute intervals thereafter).
- Data Source: Link
- Raw data size and format: 7.69MB, CSV.
- Number of tags: 18.
| Tag | Description |
|---|---|
| BTC-acc_trade_price | Cumulative trading volume (KST 0:00) |
| BTC-acc_trade_price_24h | 24-hour cumulative trading volume |
| BTC-acc_trade_volume | Cumulative trading volume (KST 0:00) |
| BTC-acc_trade_volume_24h | 24-hour cumulative trading volume |
| BTC-change_price | Absolute value of price change |
| BTC-change_rate | Absolute value of price change rate |
| BTC-high_price | Highest price |
| BTC-highest_52_week_price | Highest price in 52 weeks |
| BTC-low_price | Lowest price |
| BTC-lowest_52_week_price | Lowest price in 52 weeks |
| BTC-opening_price | Opening price |
| BTC-prev_closing_price | Previous day's closing price (KST 0:00) |
| BTC-signed_change_price | Signed price change |
| BTC-signed_change_rate | Signed price change rate |
| BTC-trace_volumn | Most recent trading volume |
| BTC-trade_price | Cumulative trading volume (KST 0:00) |
| BTC-trade_volume | Most recent trading volume |
| KRW-BTC | Closing price (current price) |
- Data Time Range: 2024-11-24 11:40:00 to 2024-12-23 01:16:00.
- Number of data records collected: 445,283.
- CSV data URL: https://data.yotahub.com/2024-17/datahub-2024-17-Bitcoin.csv.gz
- Data Migration: Bitcoin Data Migration
2. Data Visualization with Machbase Neo
- Data visualization is possible through the Tag Analyzer in Machbase Neo.
- Select desired tag names and visualize them in various types of graphs.
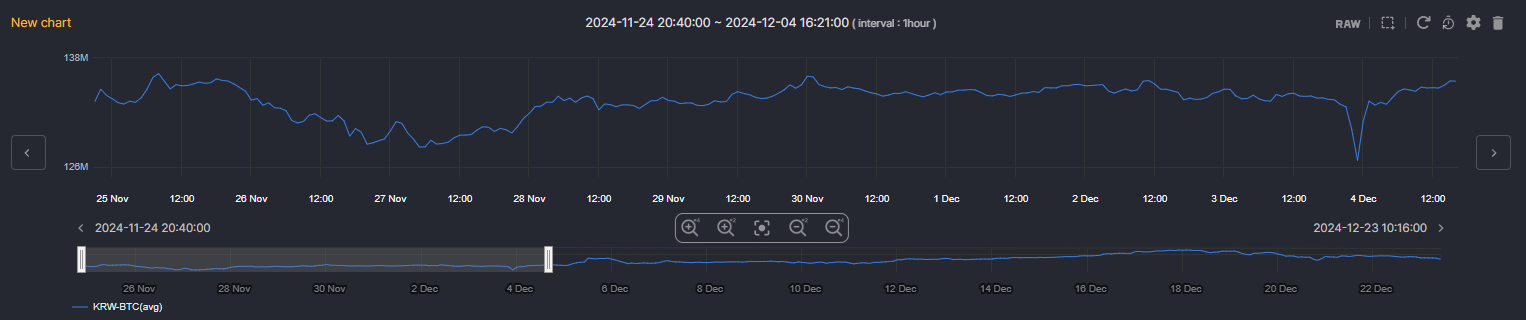
- Below, access the 2024-17 DataHub in real-time, select the desired tag names from the data of 18 tags, visualize them, and preview the data patterns.
DataHub Viewer
3. Table Creation and Data Upload in Machbase Neo
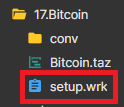
- In the DataHub directory, use setup.wrk located in the Bitcoin Dataset folder to create tables and load data, as illustrated in the image below.
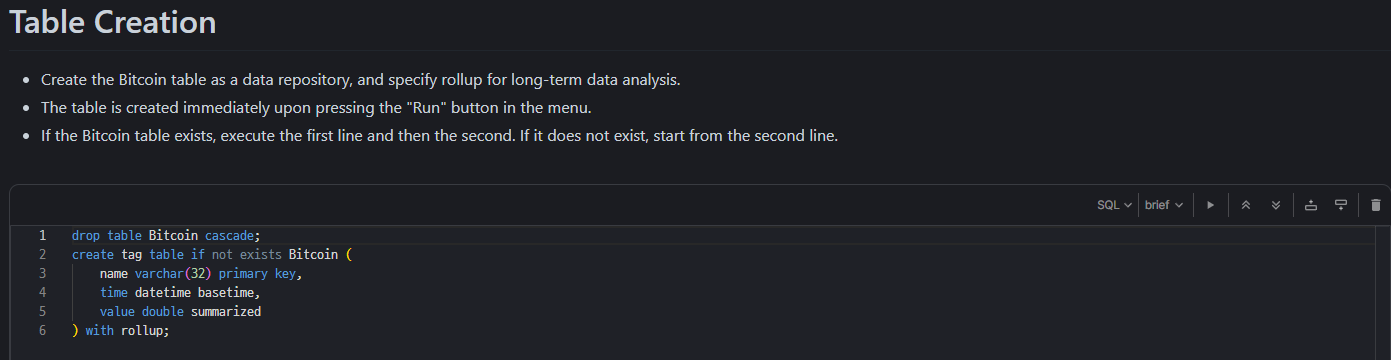
1) Table Creation
- The table is created immediately upon pressing the "Run" button in the menu.
- If the Bitcoin table exists, execute the first line and then the second. If it does not exist, start from the second line.
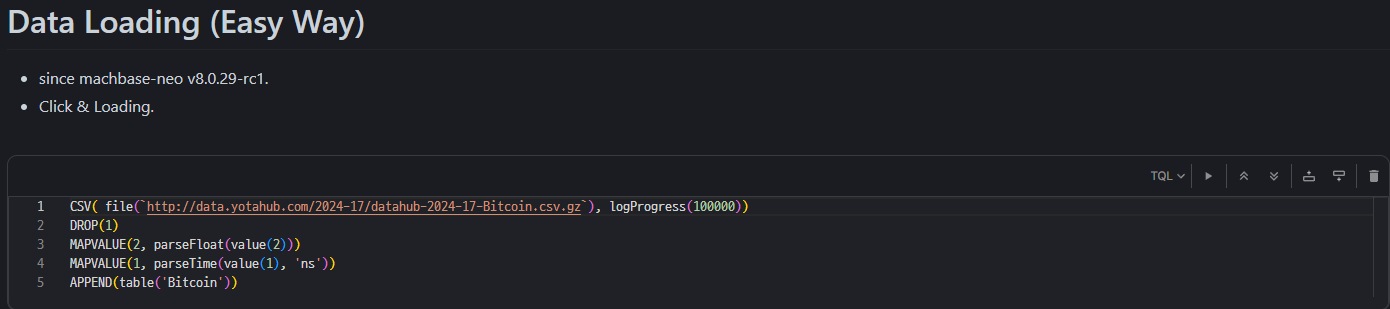
2) Data Upload
- Loading tables in two different ways.
Method 1) Table loading method using TQL in Machbase Neo (since machbase-neo v8.0.29-rc1
-
Pros
- Machbase Neo loads as soon as you hit the launch button.
-
Cons
- Slower table loading speed compared to other method.
Method 2) Loading tables using commands
-
Pros
- Fast table loading speed.
-
Cons
- The table loading process is cumbersome.
- Run cmd window - Change machbase-neo path - Enter command in cmd window.
- If run the below script from the command shell, the data will be entered at high speed into the Bitcoin table.
curl http://data.yotahub.com/2024-17/datahub-2024-17-Bitcoin.csv.gz | machbase-neo shell import --input - --compress gzip --header --method append --timeformat ns bitcoin
- If specify a separate username and password, use the --user and --password options (if not sys/manager) and add the options as shown below.
curl http://data.yotahub.com/2024-17/datahub-2024-17-Bitcoin.csv.gz | machbase-neo shell import --input - --compress gzip --header --method append --timeformat ns bitcoin --user USERNAME --password PASSWORD
4. Experimental Methodology
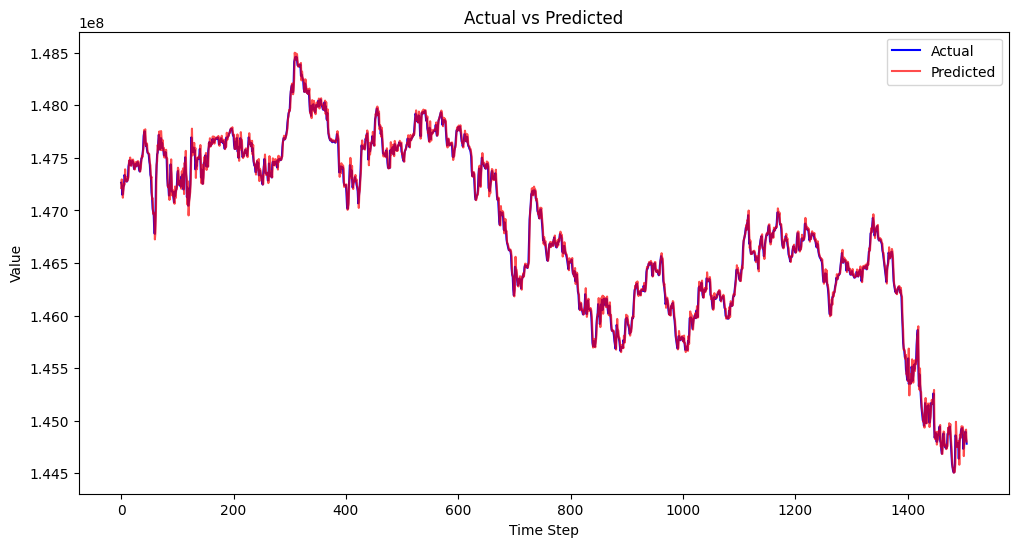
- Model Objective: Bitcoin Price Forecasting.
- Tags Used: KRW-BTC.
- Model Configuration: SparseTSF.
- Goal: Forecasting the Bitcoin Price for the next 1 minute using data from the past 10 minutes.
- Learning Method: supervised Learning.
- Train: Model Training.
- Test: Model Performance Evaluation Based on Bitcoin Price Forecasting.
- Model Optimizer: Adam.
- Model Loss Function: Mean Squared Error.
- Model Performance Metric: Mean Squared Error & R2 Score.
- Data Loading Method
- Loading the Entire Dataset.
- Loading the Fetch Dataset.
- Data Preprocessing
- MinMax Scaling.
5. Experiment Code
Bitcoin Data Exploratory Data Analysis
- Composed of three methods.
- Data Information: Outputs general information about the data.
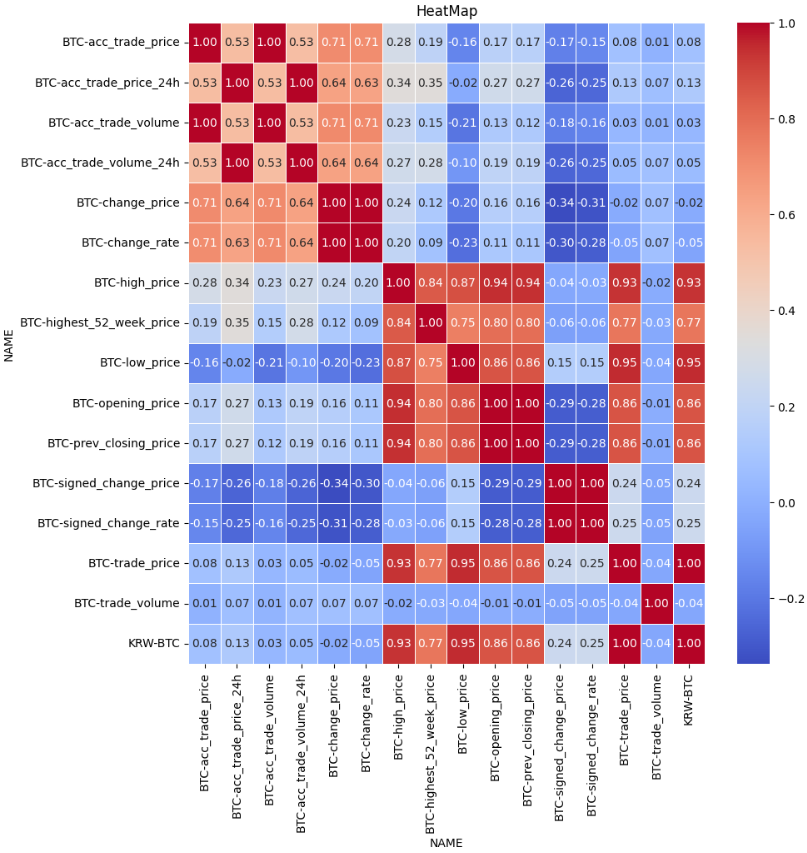
- Visual Information: correlation heatmap, plot, Decomposition about the data.
- Statistical Test: ADF Test, KPSS Test, PP Test, ljung box Test, Arch Test, VIF Test about the data.
- The entire code can be run through 17.Bitcoin_EDA.ipynb.
Bitcoin Price Forecasting
- Below is the code for each of the two ways to get data from the database.
- If all the data can be loaded and trained at once without causing memory errors, then method 1 is the fastest and simplest.
- If the data is too large, causing memory errors, then the batch loading method proposed in method 2 is the most efficient.
Method 1) Loading the Entire Dataset
- The code below is implemented in a way that loads all the data needed for training from the database all at once.
- It is exactly the same as loading all CSV files (The only difference is that the data is loaded from Machbase Neo).
- Pros
- Can use the same code that was previously utilizing CSVs (Only the loading process is different).
- Cons
- Unable to train if trainable data size exceeds memory size.
- The entire code can be run through 17.Bitcoin_Full.ipynb.
Method 2) Loading the Fetch Dataset
- Method for loading data from the Machbase Neo for a buffer size.
- Pros
- It is possible to train the model regardless of the data size, no matter how large it is.
- Cons
- It takes longer to train compared to method 1.
- The entire code can be run through 17.Bitcoin_Buffered_Fetch.ipynb.
6. Experimental Results
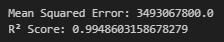
Method 1) Loading the Entire Dataset Result
Method 2) Loading the Fetch Dataset Result
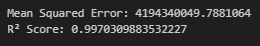
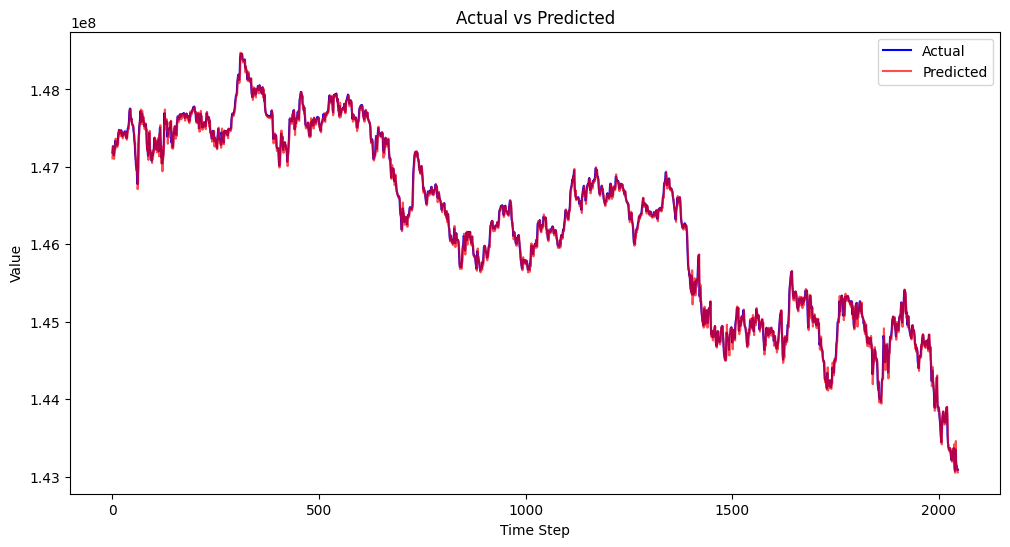
- The R2 score shows high performance above 0.9 in both methods.
- Since the original values are very large, the MSE values are also high in both methods.
- Reducing the MSE value will be a future task.
※ Various datasets and tutorial codes can be found in the GitHub repository below.
datahub/dataset/2024 at main · machbase/datahub
All Industrial IoT DataHub with data visualization and AI source - machbase/datahub
 machbase